cwl-metrics

Container virtualization technology to improve portability of software tools is getting popular everywhere: also in the field of Bioinformatics/Computational biology, where many data analysis tools for many study purposes are implemented and distributed as open source software, the containers are helping people to maintain their data analysis environment. The new community standard Common Workflow Language (CWL) is also contributing to making it easy to share workflows, a set of tools packaged in containers.
In the era of big genomic data, researchers need more machines as much more data is coming. This situation pushes to make tools and workflows portable to use cloud computing services which offer on-demand flexible computational environments. However, to optimize the use of cloud environments users have to know which cloud instance is the best for their purposes - based on the resource usage metrics of tools and workflows.
CWL-metrics is a framework to collect and analyze computational resource usage of workflow runs based on the CWL. CWL-metrics launches a daemon process to catch cwltool processes, Telegraf to collect the resource usage via docker API, and Elasticsearch to store the collected data.
The CWL-metrics preprint is available on bioRxiv. The materials used in the manuscript including Jupyter Notebook is available on GitHub.
Prerequisites
gitcurlperldockerdocker-compose(version 3)cwltool- recommended version:
1.0.20180820141117or later
- recommended version:
Install
Use curl to fetch the install script from GitHub and exec via bash command as:
$ curl "https://raw.githubusercontent.com/inutano/cwl-metrics/master/bin/cwl-metrics" | bash
This will do followings:
- Check prerequisites
- Create
$HOME/.cwlmetrics - Fetch required tools
- CWL-metrics daemon script (this repository)
- docker-metrics-collector repository
- cwl-log-generator docker container
- cwl-metrics-client docker container
- Generate config files
- Run CWL-metrics
Installing CWL-spec will pull the following containers to your host environment:
telegraffor collecting container metricssebp/elkfor Elasticsearch and Kibanaquay.io/inutano/run-dmcfor setting up docker-metrics-collectorquay.io/inutano/fluentdfor sending log data to Elasticsearchquay.io/inutano/cwl-log-generatorfor processing workflow metadataquay.io/inutano/cwl-metrics-clientfor summarizing metrics data
Usage
Launch CWL-metrics system
CWL-metrics will start automatically after the installation. The cwl-metrics command is at $HOME/.cwlmetrics/bin/cwl-metrics. chmod +x $HOME/.cwlmetrics/bin/cwl-metrics and export PATH=$HOME/.cwlmetrics/bin:$PATH would be useful to execute the command wherever you need.
Do any of followings to control CWL-metrics:
cwl-metrics status: shows if the system is runningcwl-metrics start: launches the metrics collection systemcwl-metrics stop: stops the metrics collection system
Collect workflow resource usage
CWL-metrics is using cwllog-generator for extracting workflow metadata. The current version of cwllog-generator supports only cwltool for CWL execution engine, and require some options on running. While the system is running, run cwltool with options below to collect workflow metadata:
--debug--leave-container--timestamps--compute-checksum--record-container-id--cidfile-dir </path/to/container_id_dir>--outdir </path/to/cwl_result_dir>2> </path/to/debug_output_log_file>(redirect stderr to a file)
Example:
$ cwl-metrics start
$ cwl-metrics status
cwl-metrics is running.
$ cd /home/inutano/workflows/kallisto
$ ls
kallisto.cwl kallisto.yml
$ mkdir result
$ cwltool --debug --leave-container --timestamps --compute-checksum --record-container-id --cidfile-dir $(pwd)/result --outdir $(pwd)/result kallisto.cwl kallisto.yml 2> $(pwd)/result/cwltool.log
Visualize data on Elasticsearch/Kibana
Collected metrics data are stored in Elasticsearch which exposes the port 9022. To check the status of the Elasticsearch server, run the following command:
$ curl localhost:9200/_cluster/health?pretty=true
{
  "cluster_name" : "elasticsearch",
  "status" : "yellow",
  "timed_out" : false,
  "number_of_nodes" : 1,
  "number_of_data_nodes" : 1,
  "active_primary_shards" : 11,
  "active_shards" : 11,
  "relocating_shards" : 0,
  "initializing_shards" : 0,
  "unassigned_shards" : 10,
  "delayed_unassigned_shards" : 0,
  "number_of_pending_tasks" : 0,
  "number_of_in_flight_fetch" : 0,
  "task_max_waiting_in_queue_millis" : 0,
  "active_shards_percent_as_number" : 52.38095238095239
}
To visualize the collected metrics data, Kibana is also available via port 5601. Access the Kibana server from localhost:5601, and you will see the dashboard screen like below:
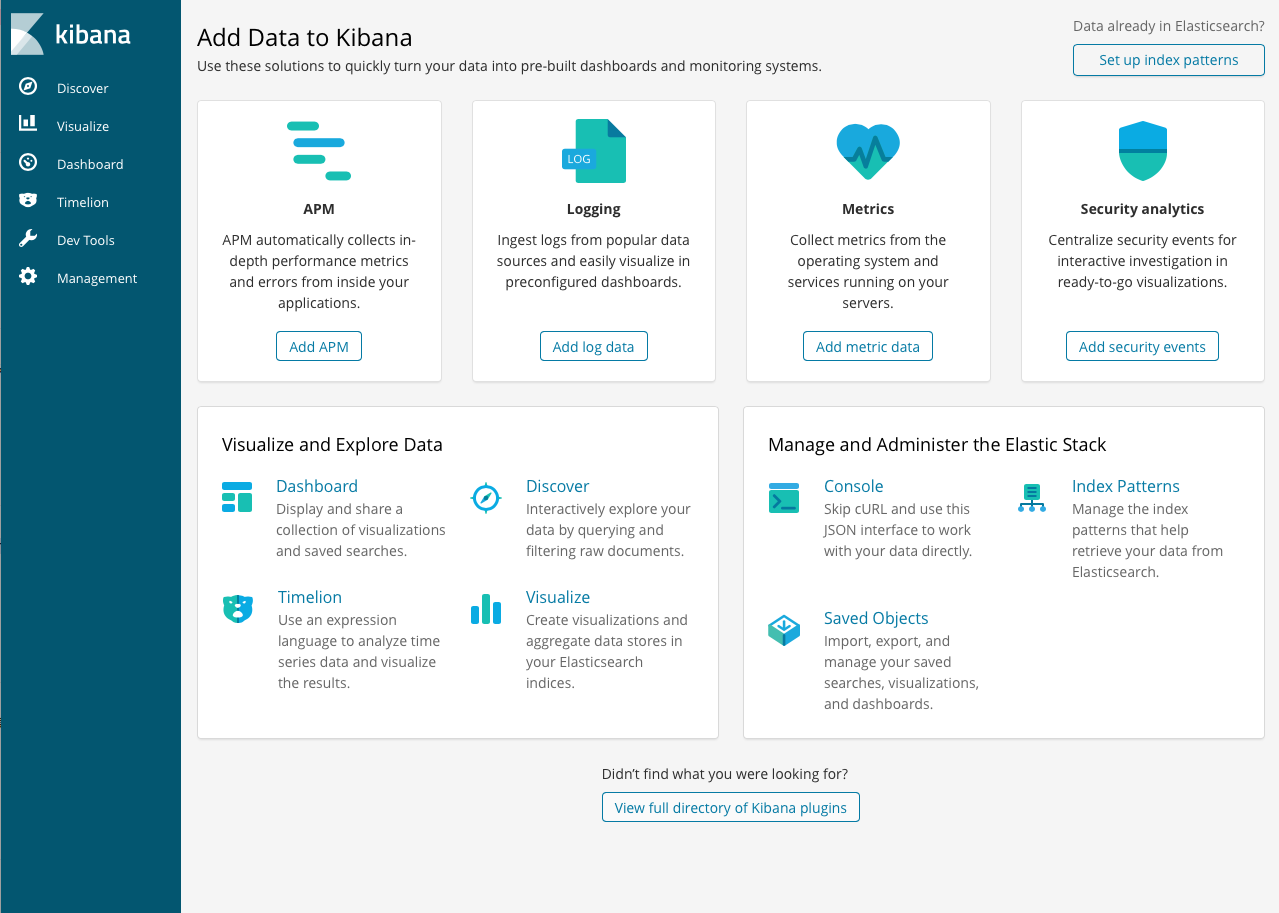
Click “Set up index patterns”.
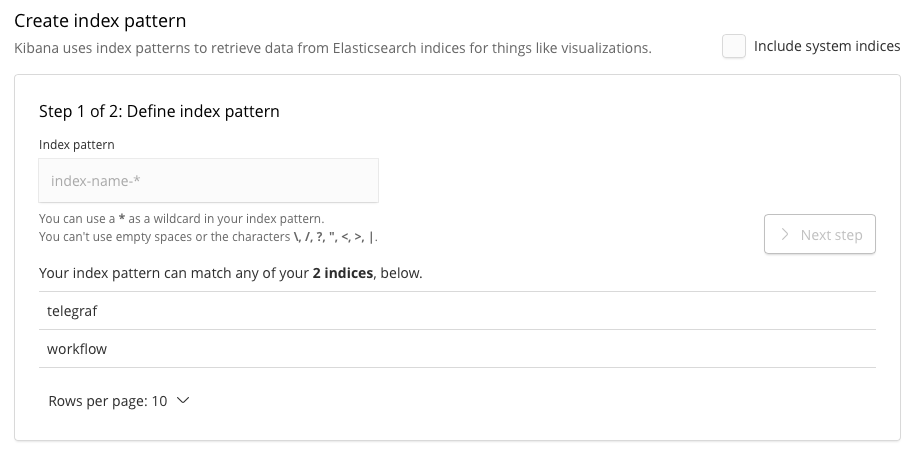
In this screen you have to create an index pattern while we have only two indices named “telegraf” and “workflow”, which contain the metrics data and workflow metadata, respectively. Type “telegraf” to filter the indices, and click “next step”. In the next step you have to configure time filter field name. Click the drop down, and select “timestamp”, then click “Create index pattern”. Once the index pattern successfully created, visit “Discover” in the left side menu. You will see the timeline of collected data and the list of records like the screenshot below.
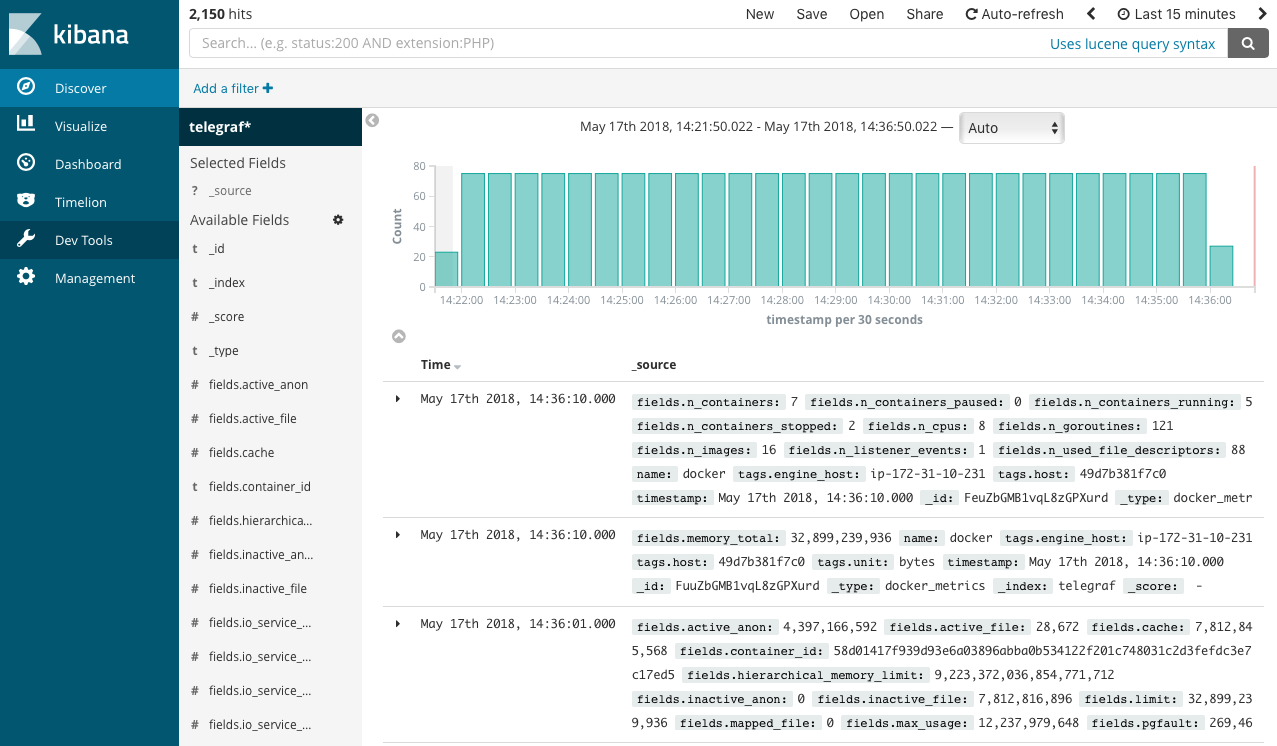
In this screen you can see all the data stored in the Elasticsearch server, and Kibana has some useful visualization tools which can aggregate data and draw plots, but the raw telegraf metrics data are pieces of metrics for each 5 seconds of workflow runs, which has to be concatenated. To get simple statistics like total memory usage by workflow runs, use the cwl-metrics fetch command explained in the next section.
Summarize data by cwl-metrics fetch
cwl-metrics fetch is a command to execute cwl-metrics-client to fetch metrics data from the Elasticsearch server and aggregate metrics with the workflow metadata. The output format is JSON or TSV.
To get metrics summary in JSON (result is simplified):
$ cwl-metrics fetch json | jq .
{
	"CWL-metrics":[
	{
	  	"workflow_id":"48813280-5990-11e8-9693-0aafe96a2914",
	  	"workflow_name":"KallistoWorkflow-se.cwl",
	  	"platform":{
	  		"instance_type":"m5.2xlarge",
	  		"region":"us-east-1a",
	  		"hostname":"ip-172-31-10-231.ec2.internal"
	  	},
	  	"steps":{
	  		"135df0da59c968f22d1e394c9412cb9c3fa4580cf62616790ff79ffa162c7911":{
	  			"stepname":"kallisto_quant",
	  			"container_name":"yyabuki/kallisto:0.43.1",
	  			"tool_version":"0.43.1",
	  			"tool_status":"success",
	  			"input_files":{
	  				"SRR1274306.fastq":229279368,
	  				"GRCh38Gencode":2836547930
	  			},
	  			"metrics":{
	  				"cpu_total_percent":99.7522093765586,
	  				"memory_max_usage":4053995520,
	  				"memory_cache":152821760,
	  				"blkio_total_bytes":51630080,
	  				"elapsed_time":40
	  			}
	  		}
		}
	}]
}
in TSV:
$ cwl-metrics fetch tsv
container_id    stepname        instance_type   cpu_total_percent       memory_max_usage        memory_cache    blkio_total_bytes       elapsed_time    workflow_id     workflow_name   container_name  tool_version    tool_status     total_inputfile_size
7fc27d4d335a    kallisto_quant   m5.2xlarge             6811197440      2909052928      2956857344      20      1acbecae-5990-11e8-9693-0aafe96a2914    KallistoWorkflow-se.cwl yyabuki/kallisto:0.43.1 0.43.1  success 2951599476
And you can use any software you like to visualize the result!
Visualization
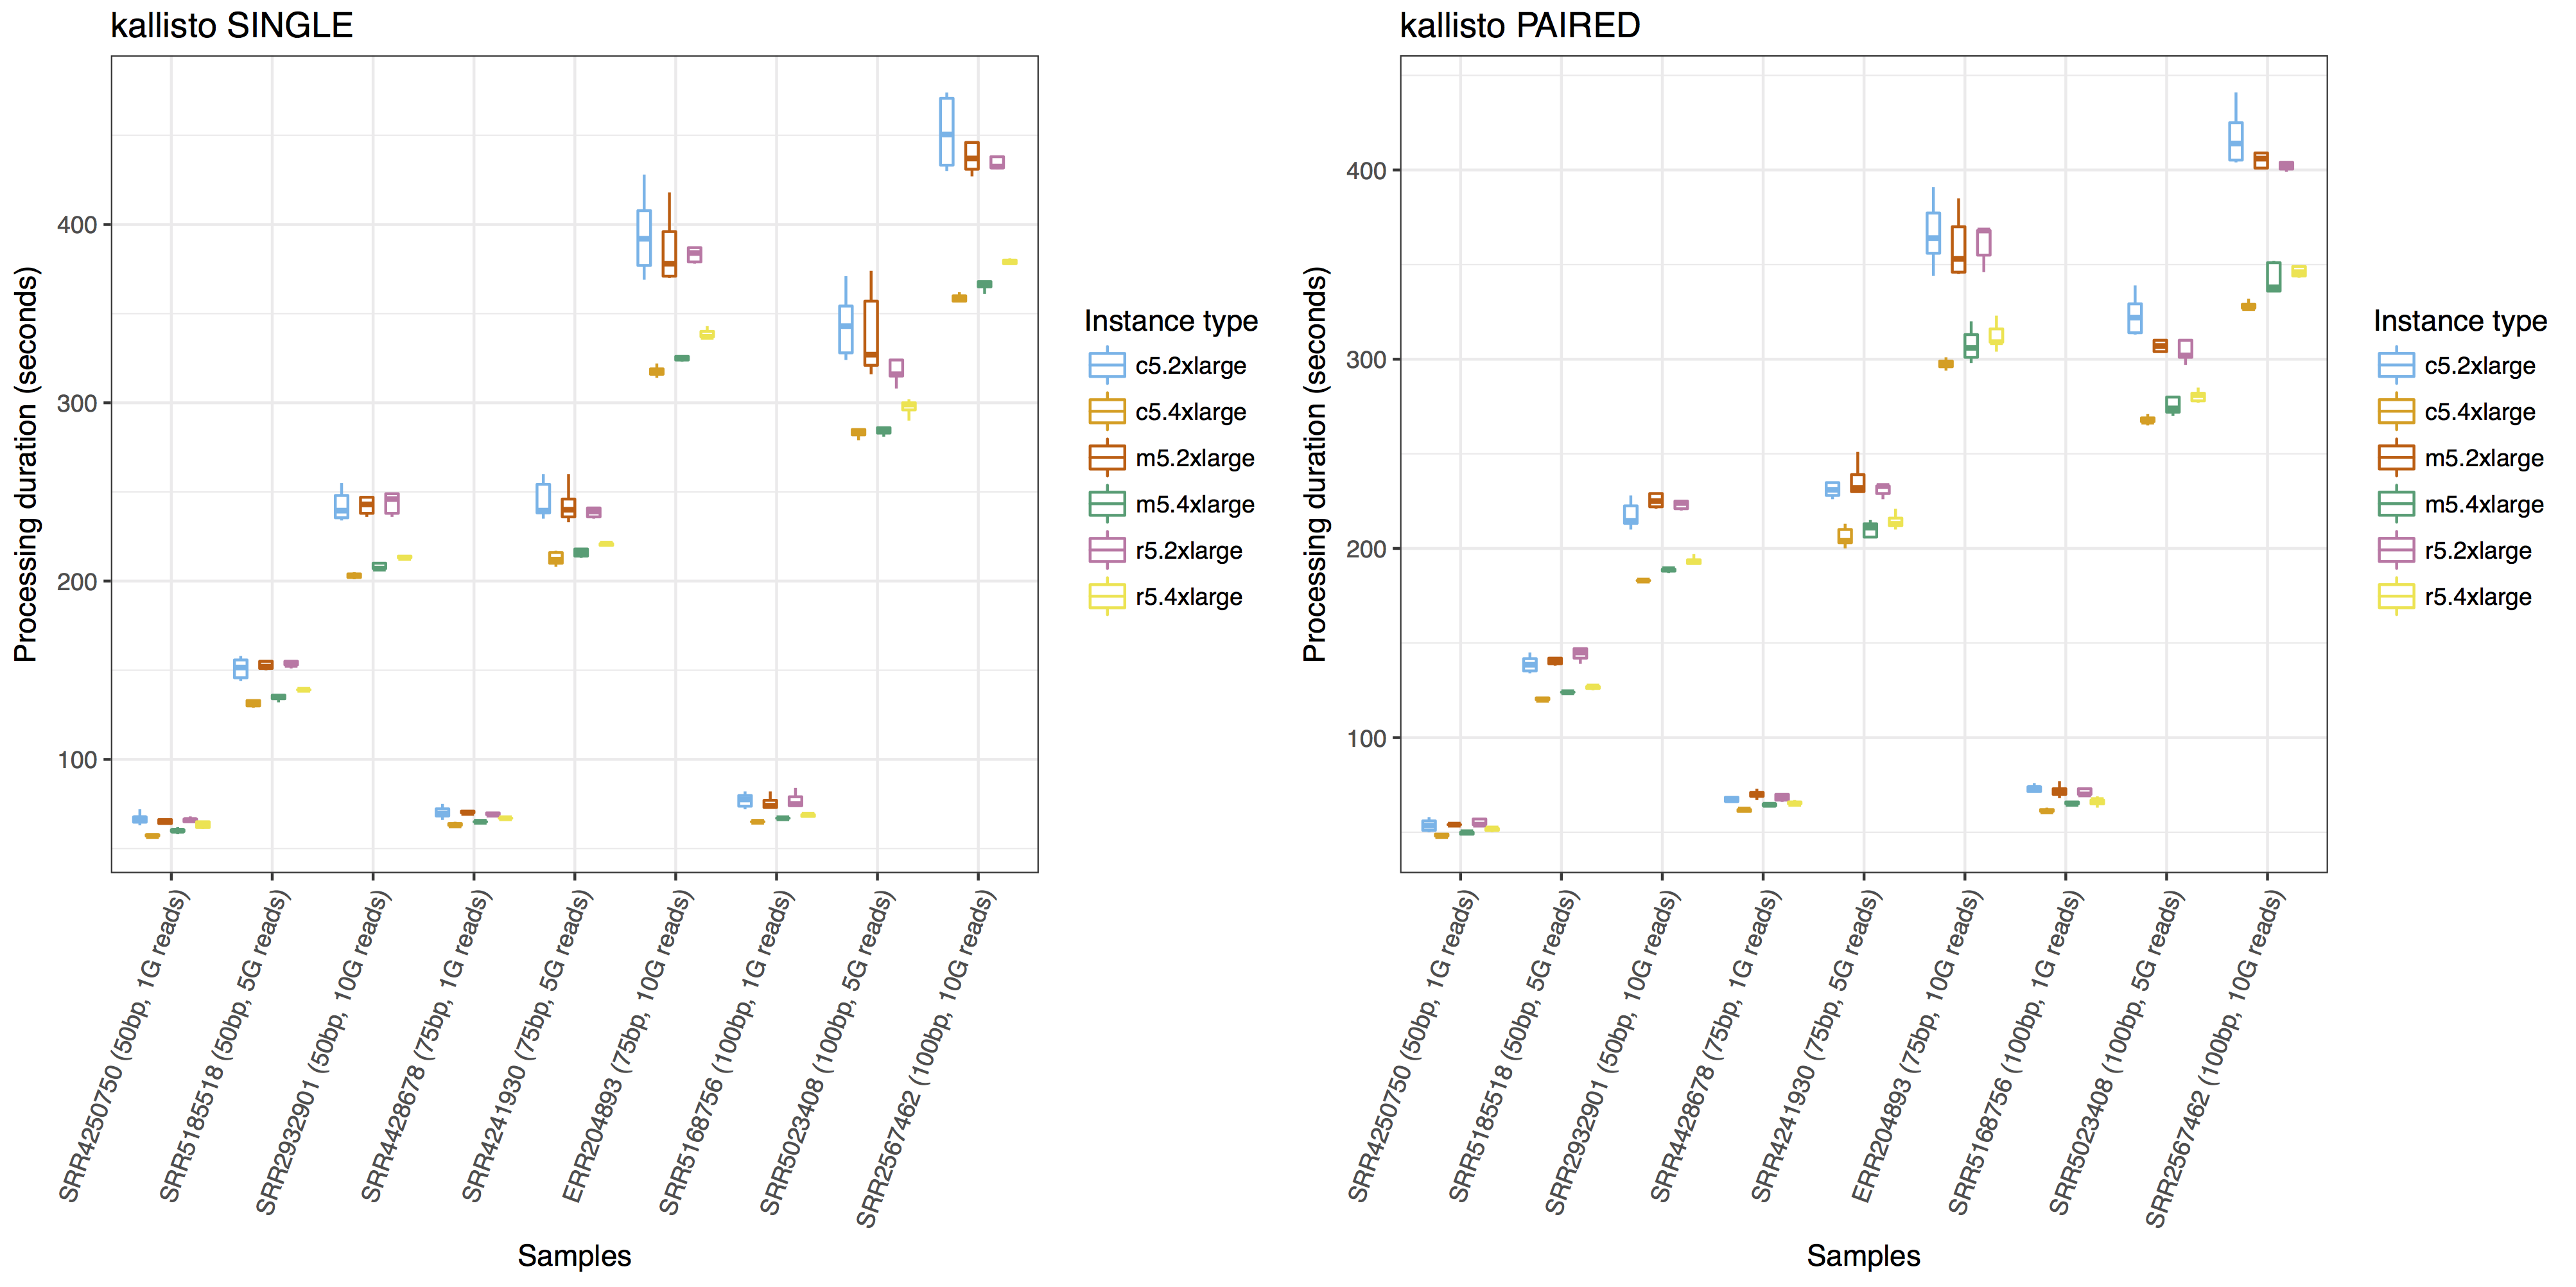
Below are the visualization examples drawn with ggplot2. The other examples are available with the Jupyter Notebook code on GitHub.
To compare the performance of a tool with different input data and different computing instances, you can visualize the workflow execution duration like below:
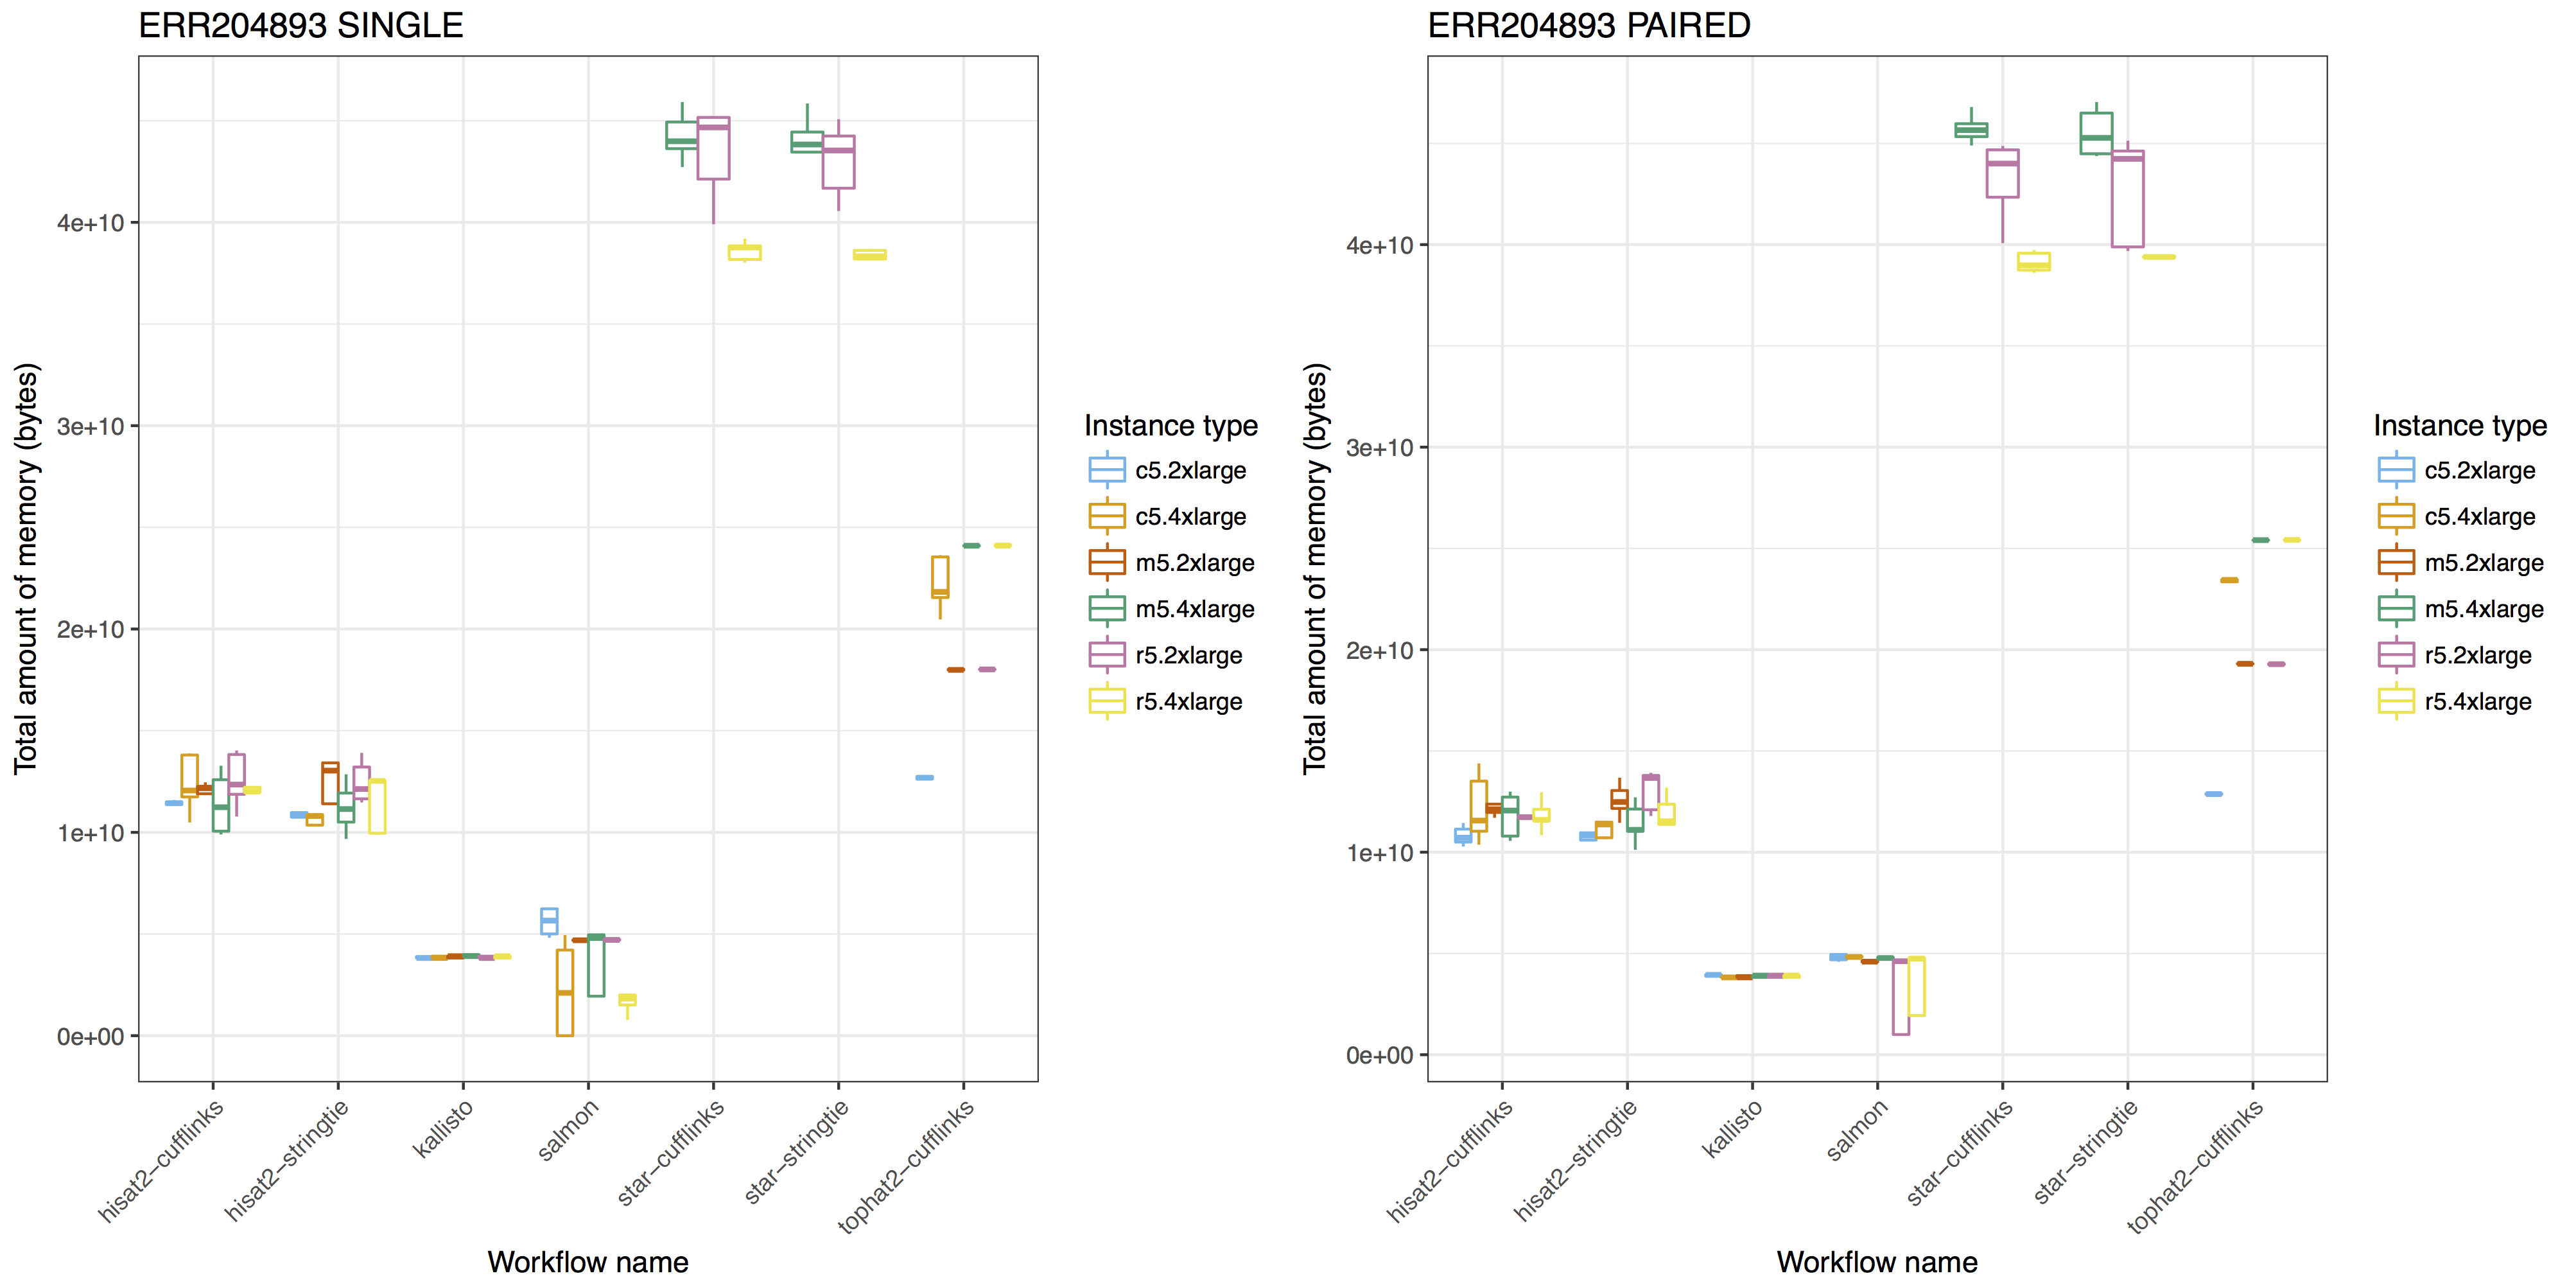
To compare the resource requirement of tools for similar purposes with same input data, you can visualize the resource usages like below:
For more examples, you can browse the notebook here.